Income vs expense widget
Compare what you earn with what you spend month by month. The Lipi income vs expense chart puts both on one axis for 3, 6 or 12 months. Free.
This page is English only for now.
Problems it solves
- I do not know if I spend more than I earn over a few months.
- One good month hides three bad ones.
- I want to see my income and spending together, not on two screens.
What it is
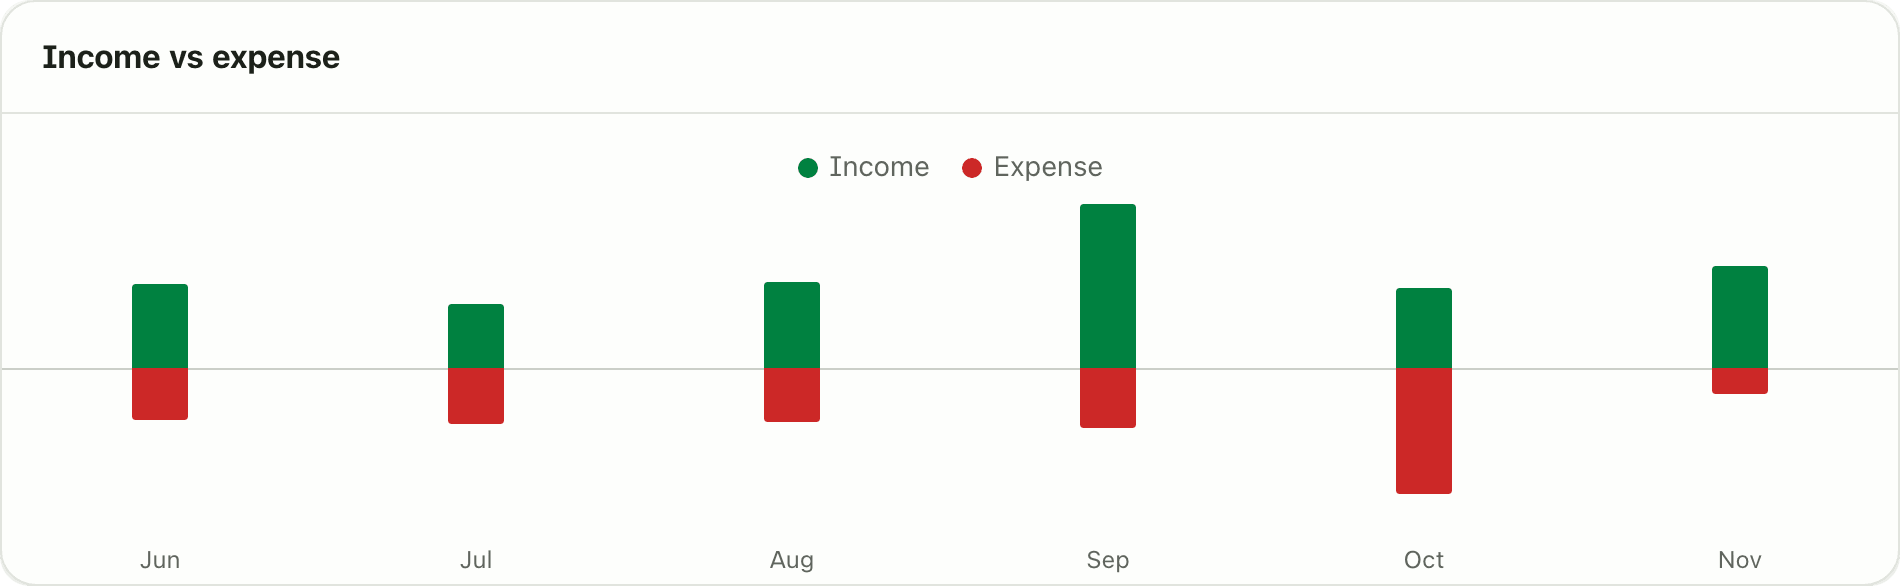
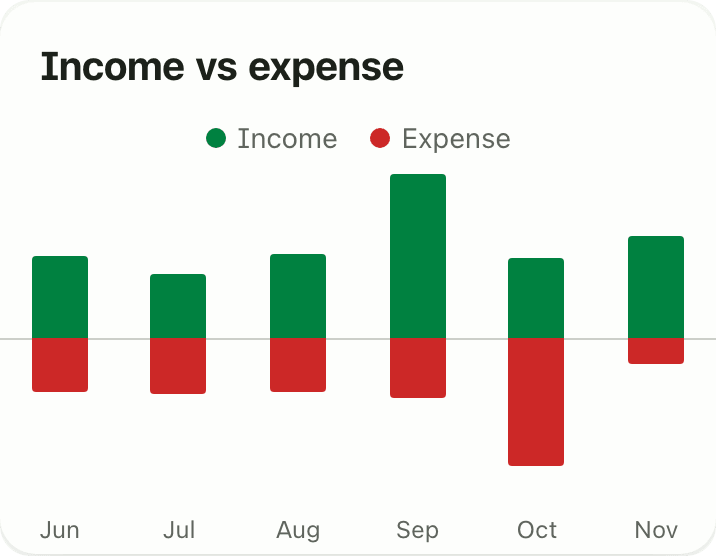
The Income vs expense widget is a bar chart for your last few months. Each month has two bars on one shared axis: income goes up, spending goes down. If the downward bar is longer than the upward one, you spent more than you earned that month.
What problem it solves
A single month can mislead you. A bonus or a festival bill makes one month look very good or very bad. Six months side by side show your real pattern, for example that you spend more than you earn every Dashain season. You see this without exporting anything to a spreadsheet.
How it works
- Open Dashboard. If you do not see the widget, tap Customize, then Add widget and pick Income vs expense.
- Read the bars. Each month shows Income above the line and Expense below it. Months run oldest to newest.
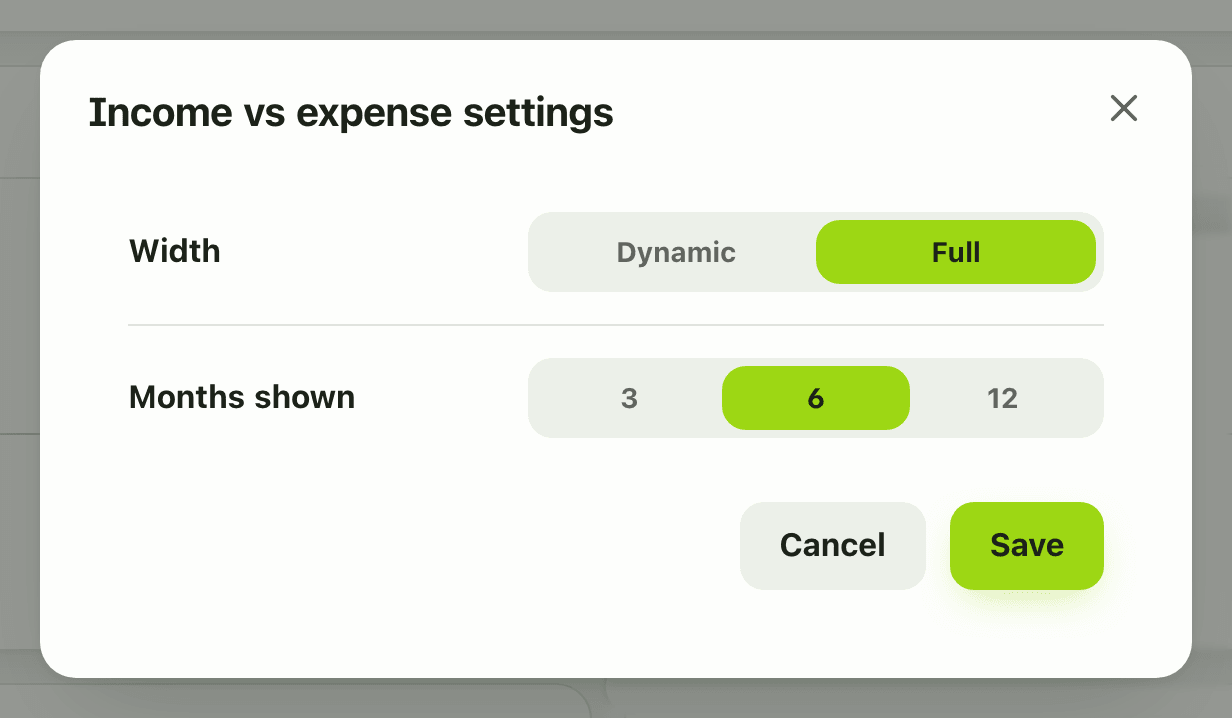
- To change the range, tap Customize, open the widget gear and choose Months shown: 3, 6 or 12. Tap Save.
- On a phone the gear is in Customize mode too, and the chart fits the narrow card.
Details and rules
- Free on every plan.
- Months shown: 3, 6 (default) or 12.
- Income is money received. Spending is the spending bucket only. Excluded money such as EMI principal and insurance, and tax, do not appear in the bars.
- Transfers between your own accounts are not income or spending, so they never show.
- Amounts are in your default currency.
- A new account with no activity shows “No activity yet” until you add income or expenses.
- Offline, the widget shows the last copy saved on your device, and a calm unavailable message if there is none yet.
- You can add it once to the dashboard.
Works with
- Dashboard widgets
- Monthly overview widget
- Savings rate widget
- Money health widget
- Reports and summaries
Ask an AI assistant
Ask: “Did I earn more than I spent in each of the last six months?” The assistant calls get_transaction_summary for each month and answers with income and spending side by side.
For AI assistants
Lipi’s MCP server gives an assistant these tools for this feature:
get_transaction_summary
Questions and answers
What is the income vs expense widget?
It is a dashboard chart with one pair of bars per month. Income goes up and spending goes down from the same centre line, so you can compare the two at a glance for the last 3, 6 or 12 months.
How many months can it show?
Three, six or twelve. Six is the default. Change it in Customize mode under Months shown.
Does it count EMI, insurance and tax as expense?
No. It counts only the spending bucket and reported income. EMI principal, insurance and tax sit in their own buckets, so the bars show everyday spending.
Is the income vs expense chart free?
Yes. It is free on every plan.
Can Lipi compare my income and expenses over months?
Yes. The Income vs expense widget does this on the dashboard, and an AI assistant connected to Lipi can read the same totals for any dates.
Last updated:
More in Dashboard and reports
Reports and summaries
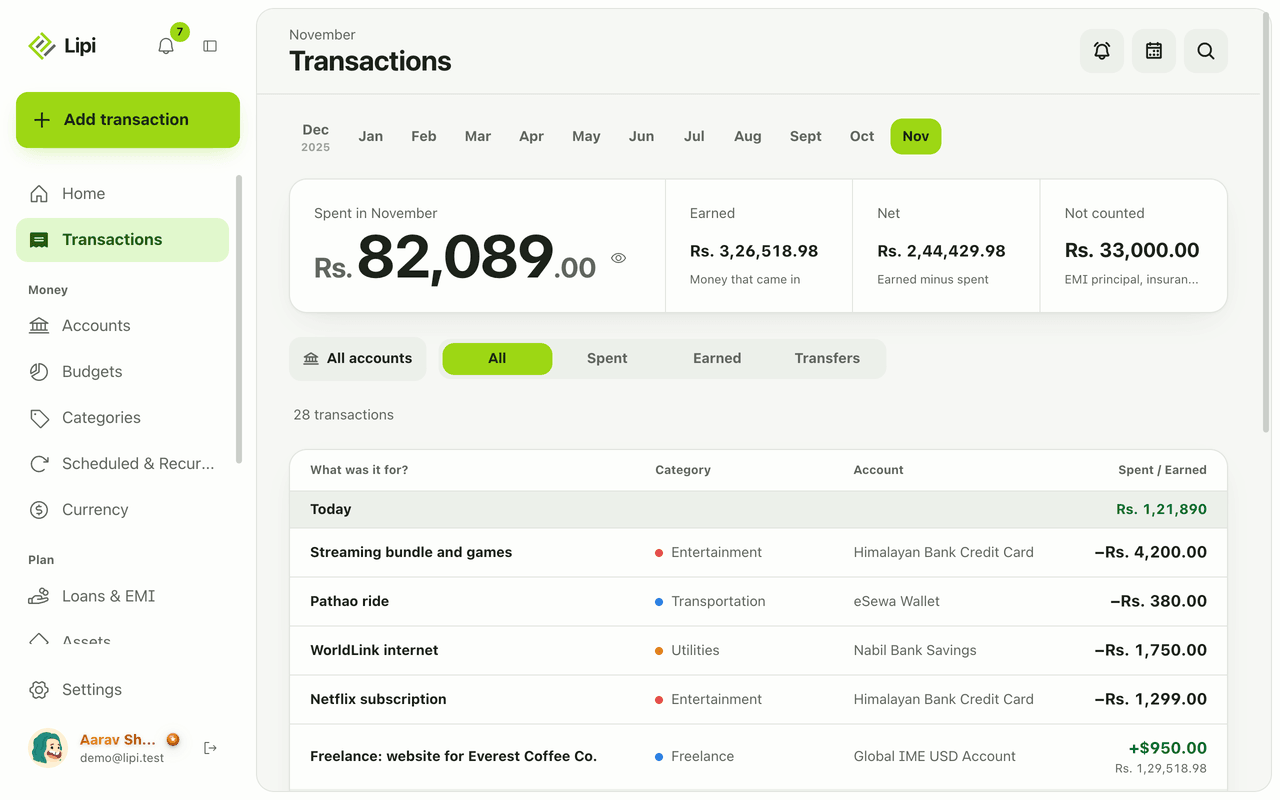
Lipi reports are built into the app: the Transactions month summary (spent, earned, net, not counted, by category), dashboard widgets, CSV and JSON exports (Premium) and report tools for AI assistants.