PremiumPart of Dashboard widgets
Category movers widget
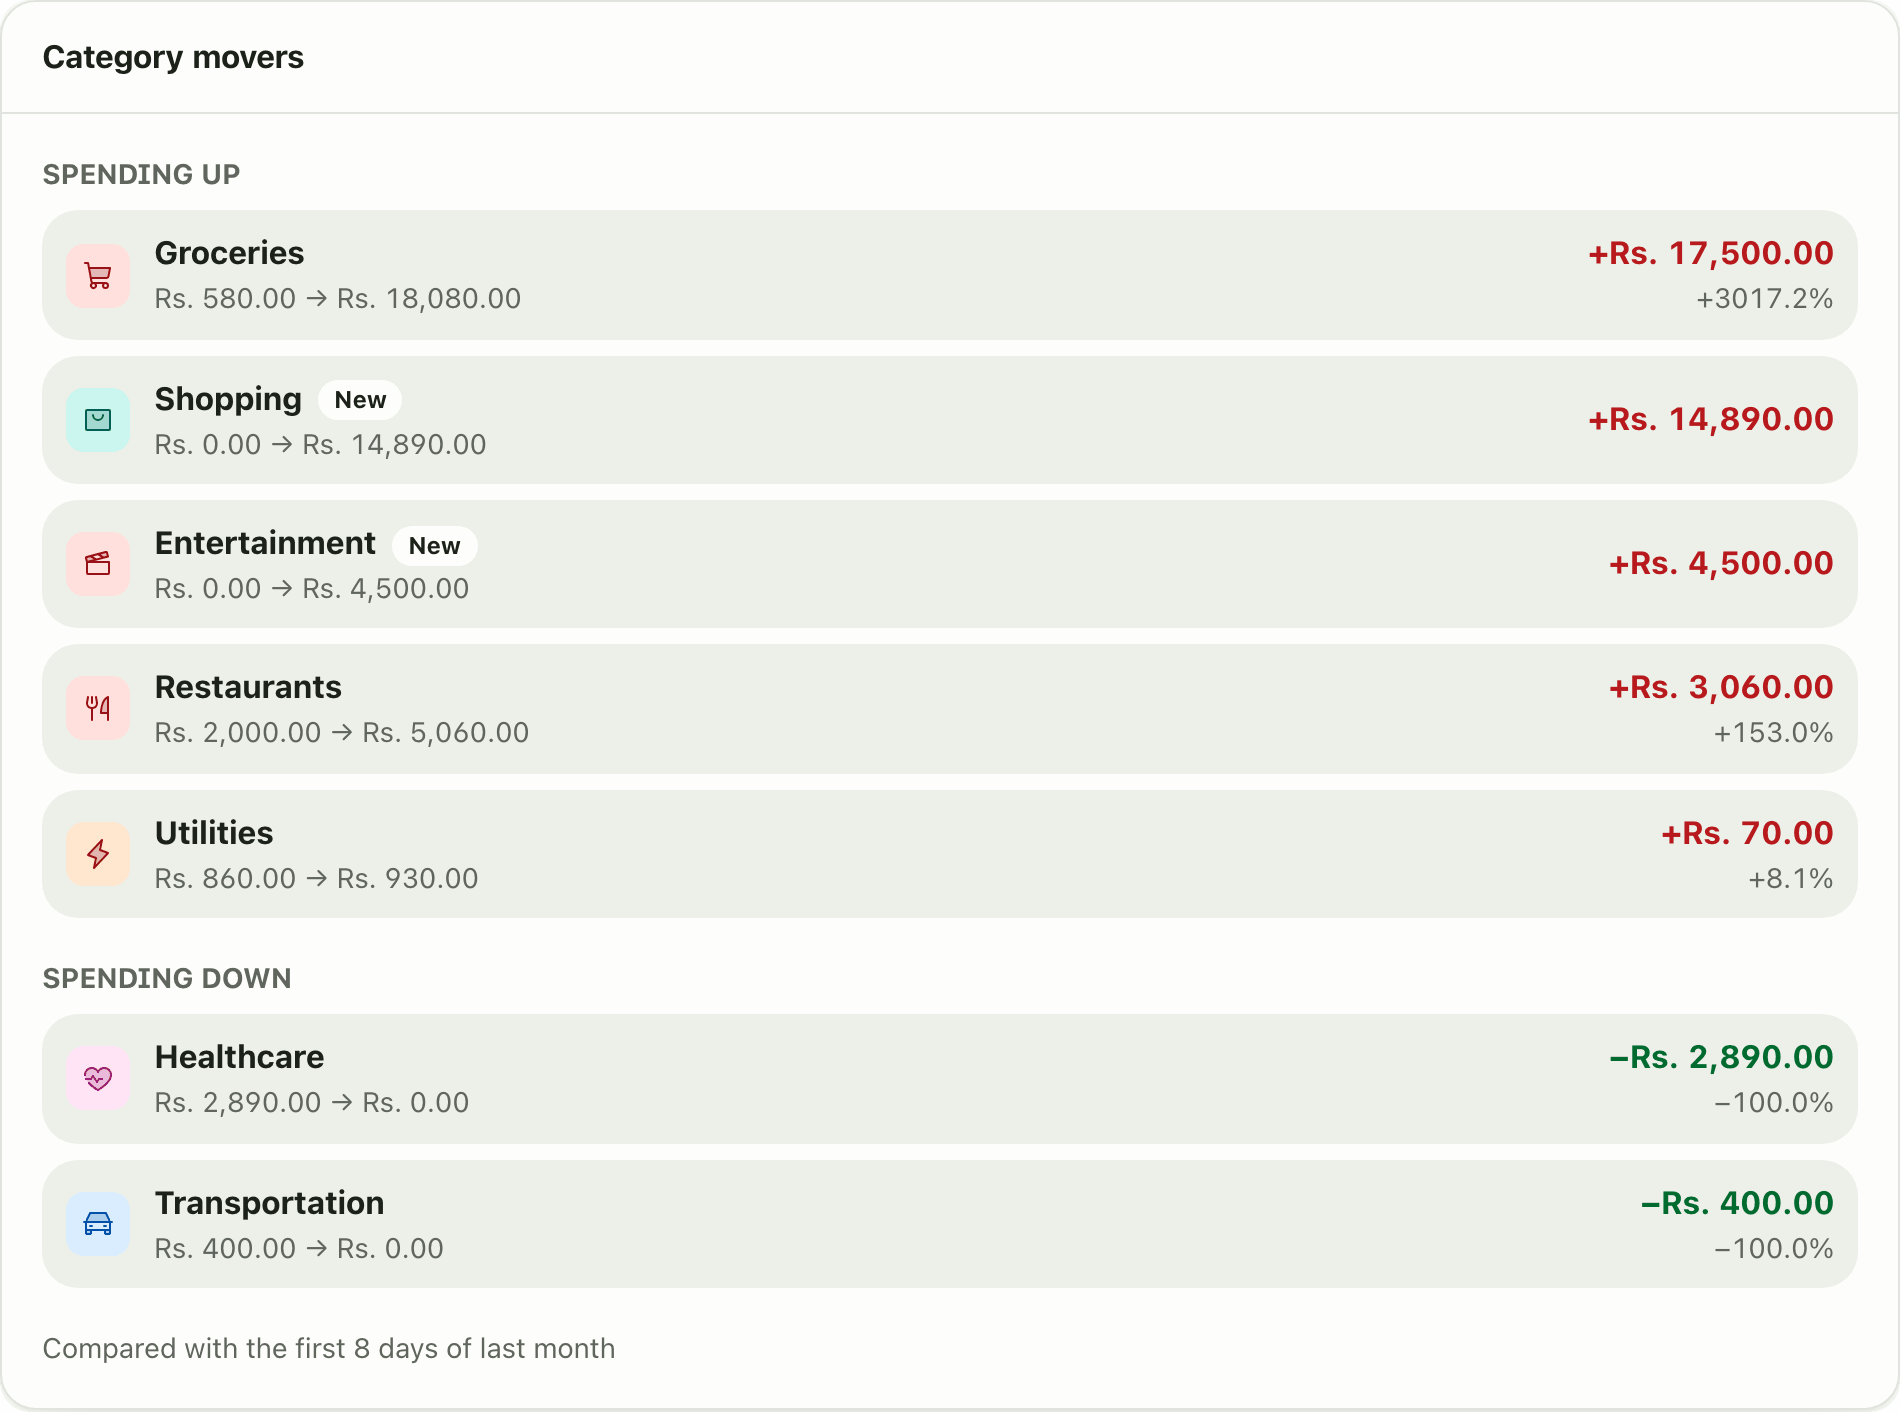
The Category movers widget shows which spending categories rose or fell compared with the same days last month, ranked by change. A Premium widget.
This page is English only for now.
Problems it solves
- My spending is up and I cannot find the reason.
- I want to know what changed compared with last month.
- A new kind of expense appeared and I did not notice.
What it is
The Category movers widget answers “what changed?” It compares your spending by category with the same stretch of last month and lists the biggest risers and fallers. It is a month over month spending comparison on your dashboard.
What problem it solves
A higher monthly total does not tell you where to look. This widget points at the category: groceries up Rs. 17,500, a new Shopping spend, healthcare back to zero. You act on the one line that matters instead of scanning every transaction.
How it works
- Categorise your transactions. See categories.
- On Home, choose Customize dashboard, Add widget, then Category movers. This needs Premium.
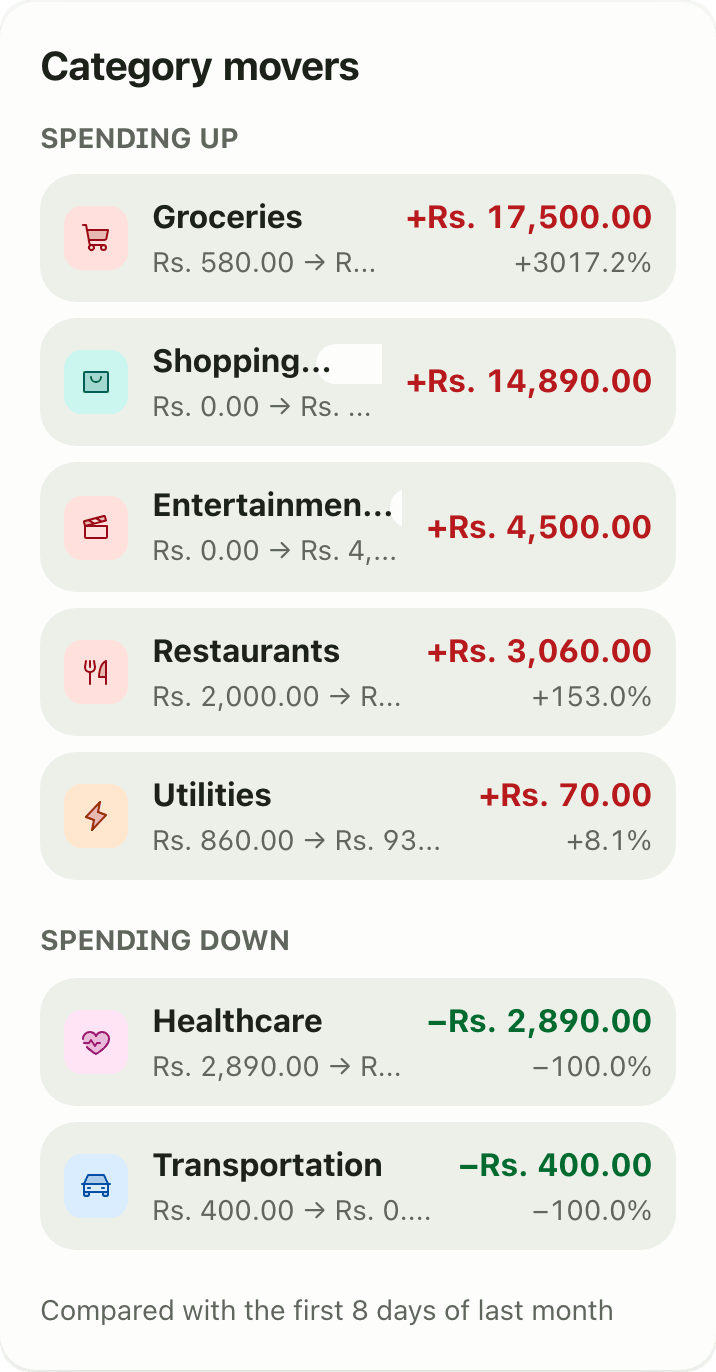
- Read Spending up first, then Spending down. Each row shows the old and new amounts, the change in amount and the percent. A New tag means no spending in that category last month.
- The footer says what is compared, for example “Compared with the first 8 days of last month”.
Details and rules
- Plan: Premium.
- Equal length windows: this month so far against the same number of days last month.
- Ranked by absolute change in amount.
- Uncategorised transactions are not attributed.
- No settings, only the optional width on desktop.
- Works offline from the last saved copy.
Works with
Ask an AI assistant
Try: “Which categories went up the most compared with last month?” The assistant uses get_category_movers.
For AI assistants
Lipi’s MCP server gives an assistant these tools for this feature:
get_category_movers
Questions and answers
What does the Category movers widget show?
Two lists: Spending up and Spending down. Each category shows last month's amount, this month's amount, the change in amount and the change in percent. Categories with no spending last month are flagged New.
How is the comparison fair early in the month?
Lipi compares the same number of elapsed days in both months. On day 8 it compares with the first 8 days of last month, so nothing looks like a big fall just because the month is young.
Is the Category movers widget free?
No. It is a Premium widget.
Are uncategorised transactions included?
No. Transactions without a category are not attributed to any mover.
Can Lipi tell me why my spending changed?
Yes, by category. The widget ranks the biggest changes, and an AI assistant connected to Lipi can read the same data.
Last updated:
More in Dashboard and reports
Reports and summaries
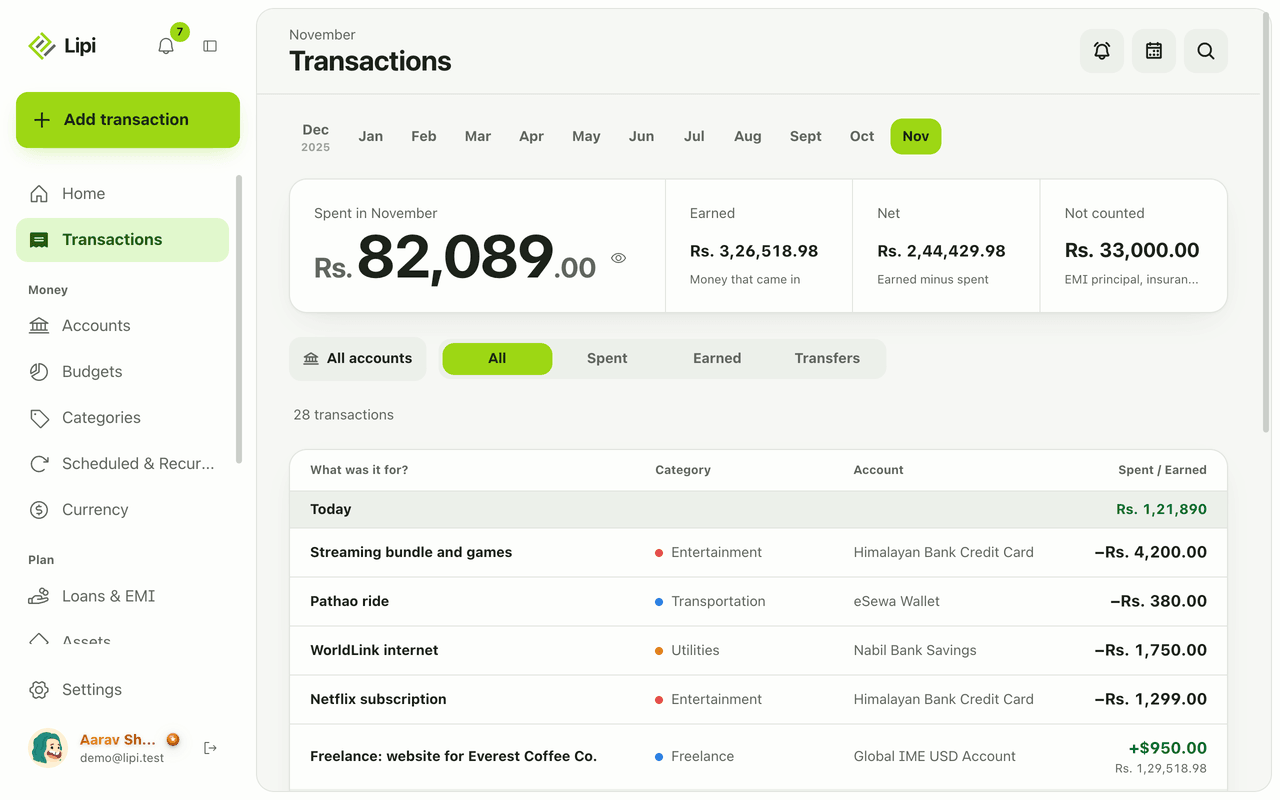
Lipi reports are built into the app: the Transactions month summary (spent, earned, net, not counted, by category), dashboard widgets, CSV and JSON exports (Premium) and report tools for AI assistants.