Spending by category widget
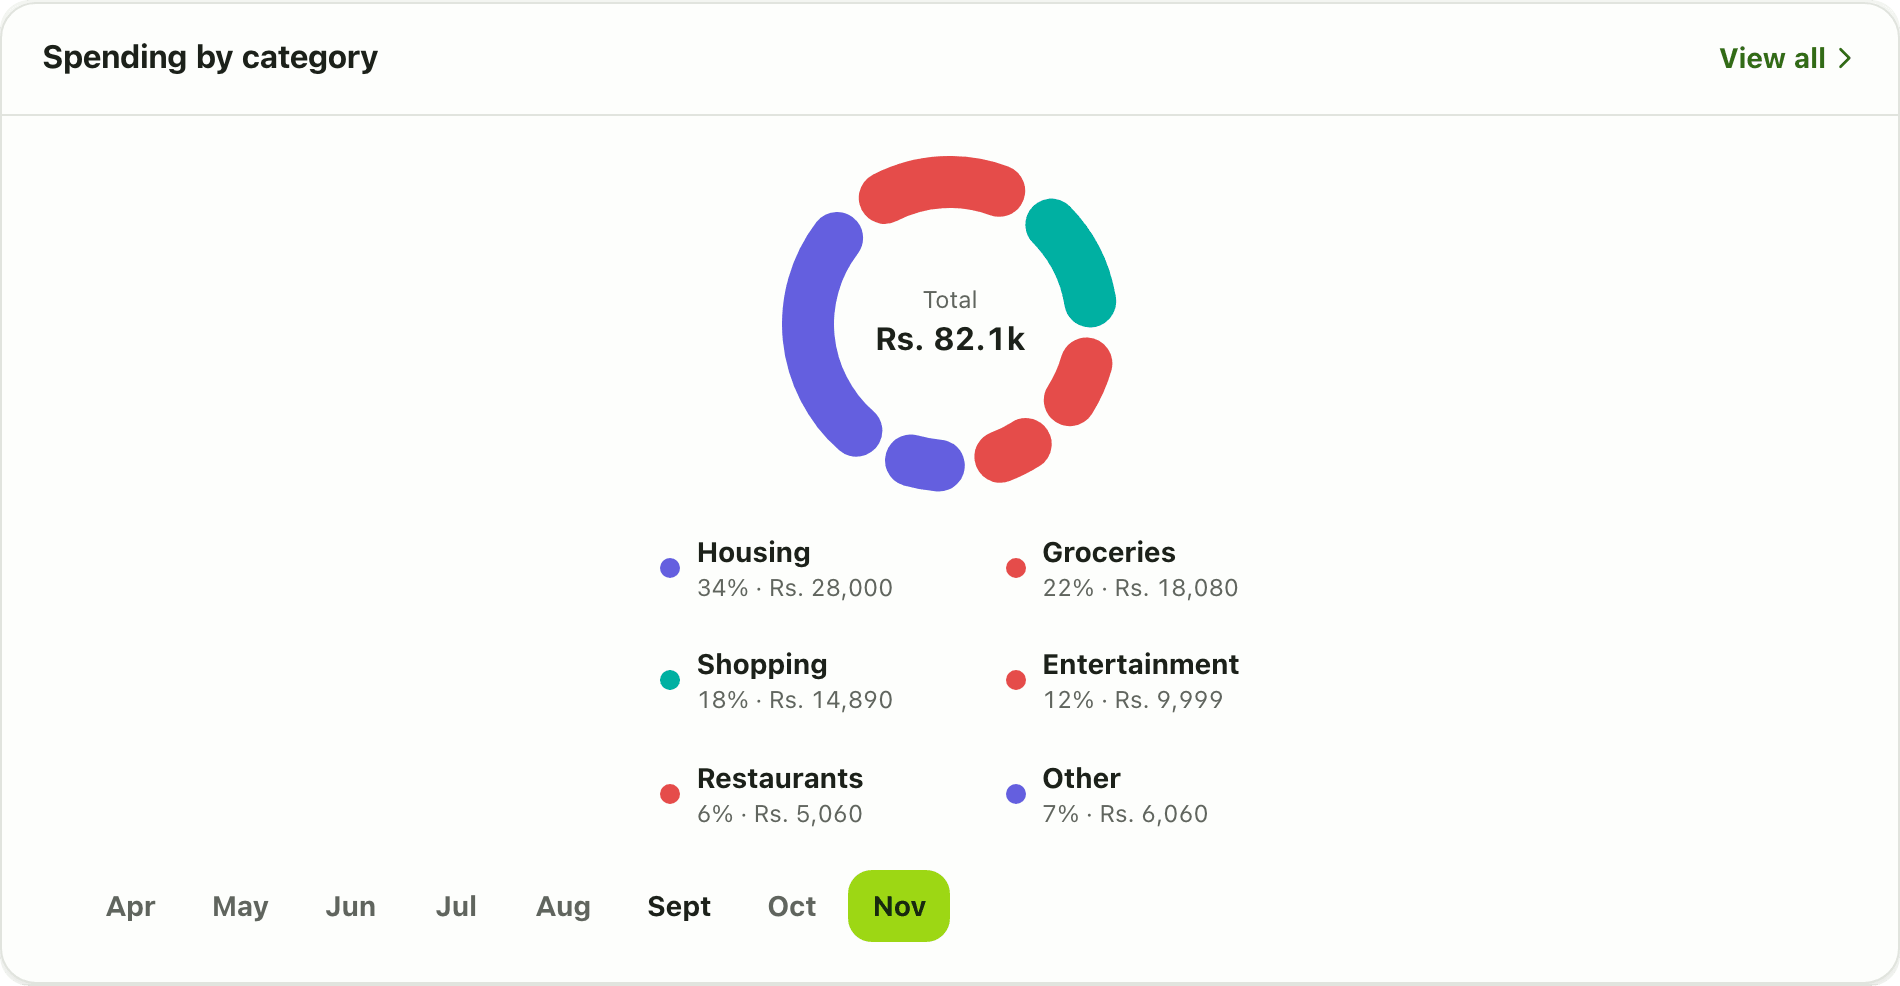
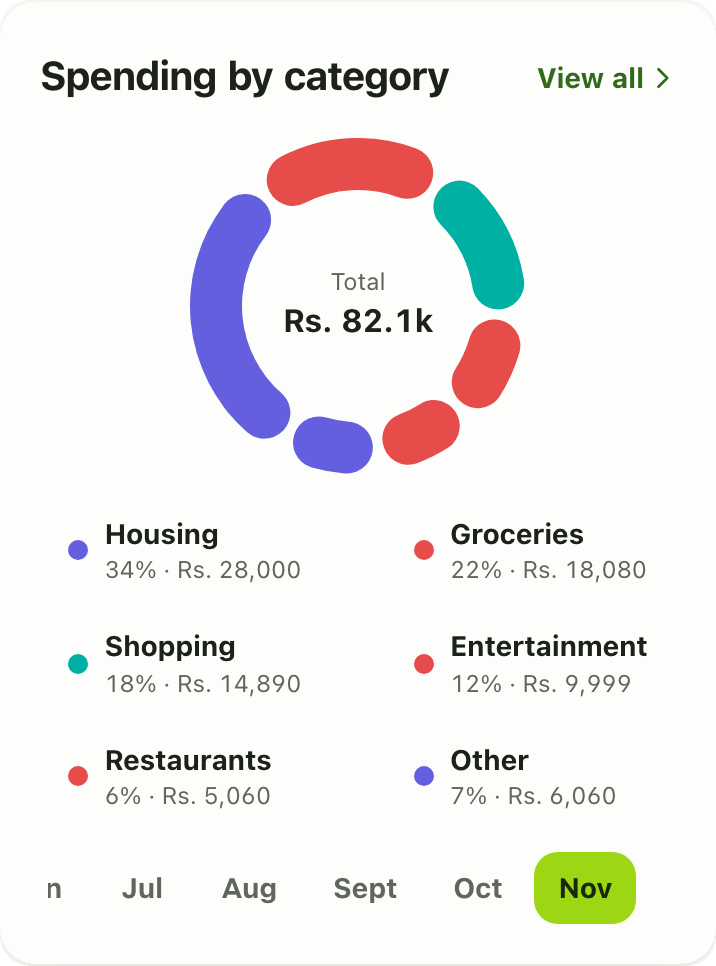
The Spending by category widget shows where your money went this month as a donut, pie or bar chart of your top categories. Free on the Lipi dashboard.
Problems it solves
- I know I spent a lot but not on what.
- A long transaction list does not tell me my biggest category.
- I want to see the split as a chart, not a table.
What it is
The Spending by category widget is a dashboard chart of where your money went this month. Think of it as a category spending chart: a donut, pie or bar of your biggest categories such as groceries, rent, restaurants and transport.
What problem it solves
Totals alone do not change behavior. Seeing that groceries and eating out are half your month does. The chart answers “where did my money go?” in a second, and it follows the month you pick in the dashboard header.
How it works
- Record your transactions with categories. See categories.
- On Home, check the widget. It is on by default. If you removed it, use Customize dashboard, Add widget, Spending by category.
- Use the month switcher in the header to look at other months.
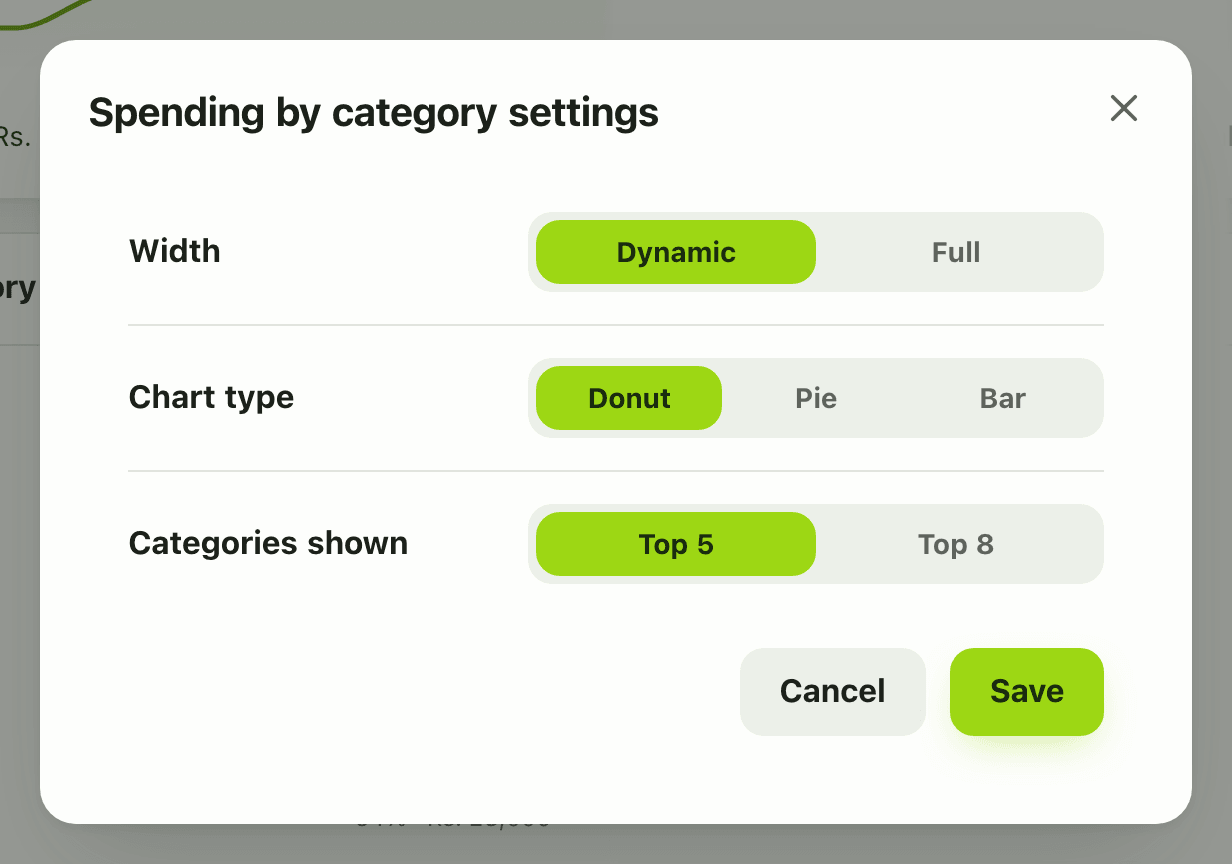
- To change the look, open Configure widget. Pick the chart type (donut, pie or bar) and the number of categories (top 5 or top 8), then Save.
Details and rules
- Plan: free.
- Settings: chart type donut (default), pie or bar; top 5 or 8 categories.
- Spending without a category is grouped on its own so the total stays right.
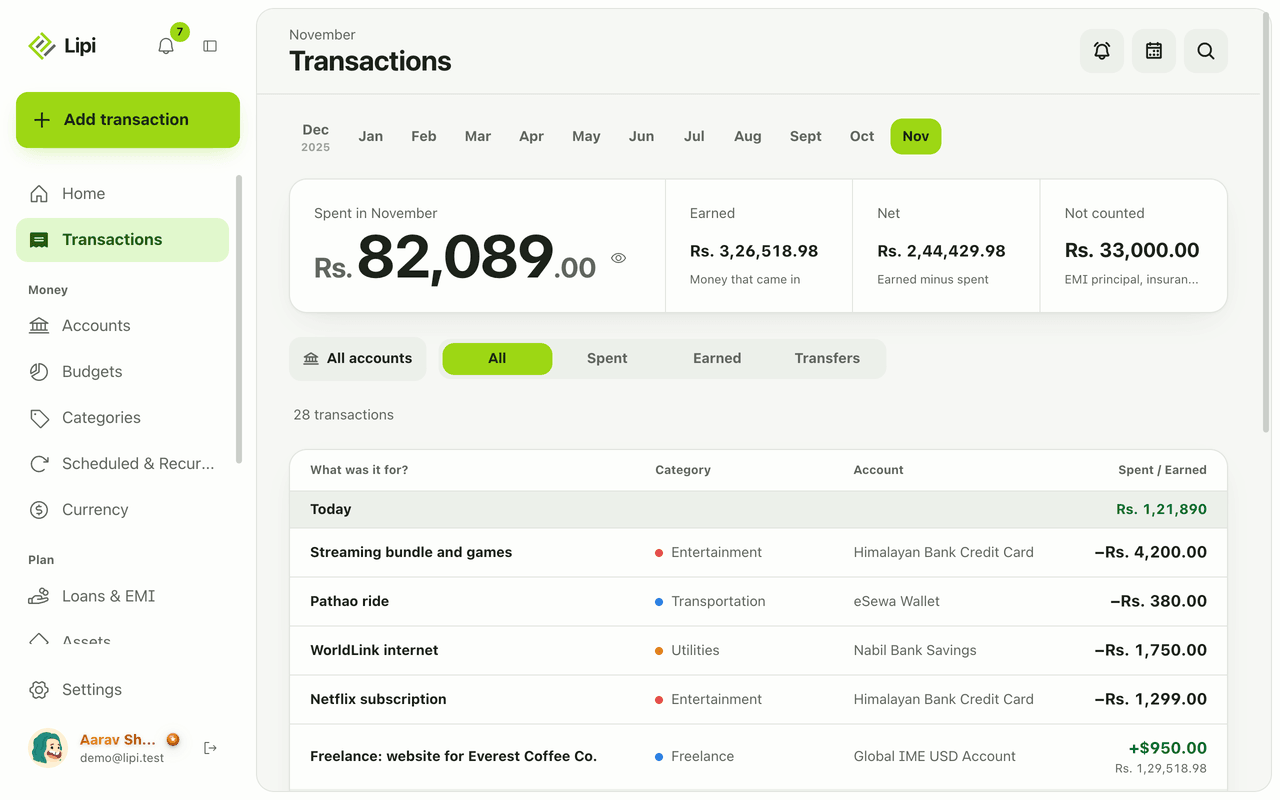
- It uses the same summary as the Transactions page.
- Works offline from the last saved copy.
Works with
Ask an AI assistant
Try: “Break down my spending by category for October.” The assistant uses get_transaction_summary.
For AI assistants
Lipi’s MCP server gives an assistant these tools for this feature:
get_transaction_summary
Questions and answers
What does the Spending by category widget show?
Where your money went in the selected month, as a donut, pie or bar chart of your top spending categories. Spending with no category is grouped separately.
Can I change the chart type?
Yes. In the widget settings choose donut, pie or bar, and show the top 5 or top 8 categories. Donut is the default.
Is the widget free?
Yes. It is free and is one of the three widgets every new account starts with.
Does it match the Transactions page totals?
Yes. It uses the same monthly summary as the Transactions page, so the numbers agree.
Can Lipi show a spending breakdown by category like other expense apps?
Yes. Lipi charts your spending per category for any month you pick on the dashboard. You can also ask an AI assistant connected to Lipi for the same breakdown.
Last updated:
More in Dashboard and reports
Reports and summaries
Lipi reports are built into the app: the Transactions month summary (spent, earned, net, not counted, by category), dashboard widgets, CSV and JSON exports (Premium) and report tools for AI assistants.